See patterns in your team's work across any time period.
Time management has become more important than ever in today's fast-paced world. Whether you are a manager, a business owner, or an employee, tracking your time is essential for maximising productivity and improving efficiency. EasyTime reports have been tailor-made to provide the insights that Software and Service Desk teams need - without configuring complicated custom reports.
Report Types
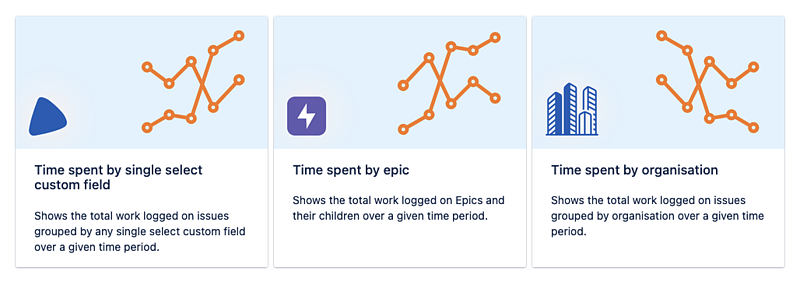
On software projects we have a report for time spent by epic, and on service desk a report for time spent by organisation. We also have a more general 'time spent by single select custom field' report available on all projects.
Accessing reports
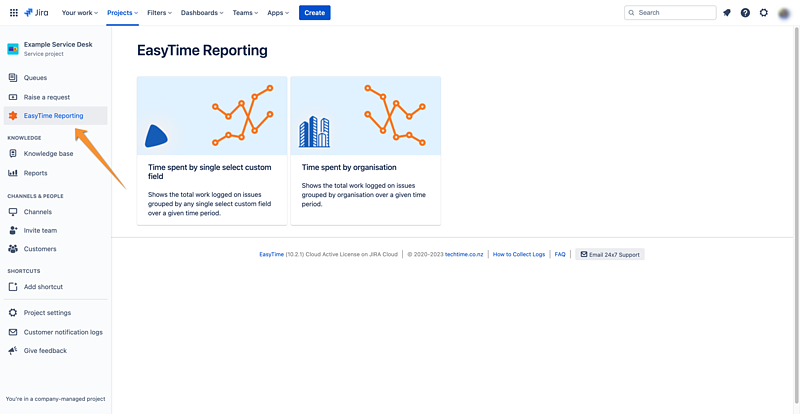
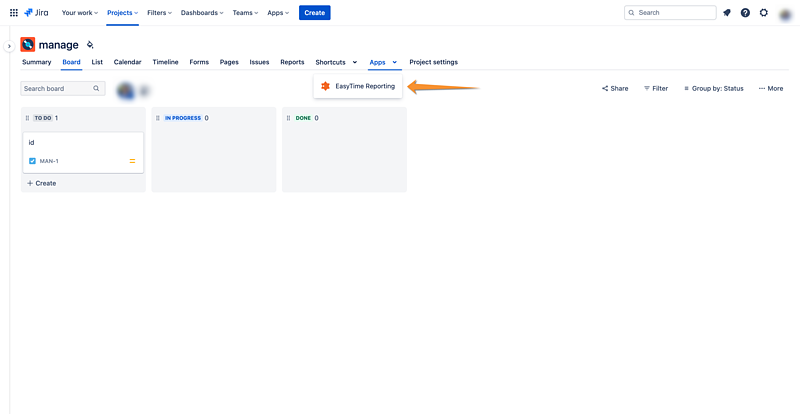
In Software and Service Desk projects EasyTime reports can be found in the project sidebar, and in Business projects they can be found under the "Apps" tab.
Display Types
Bar Chart Display
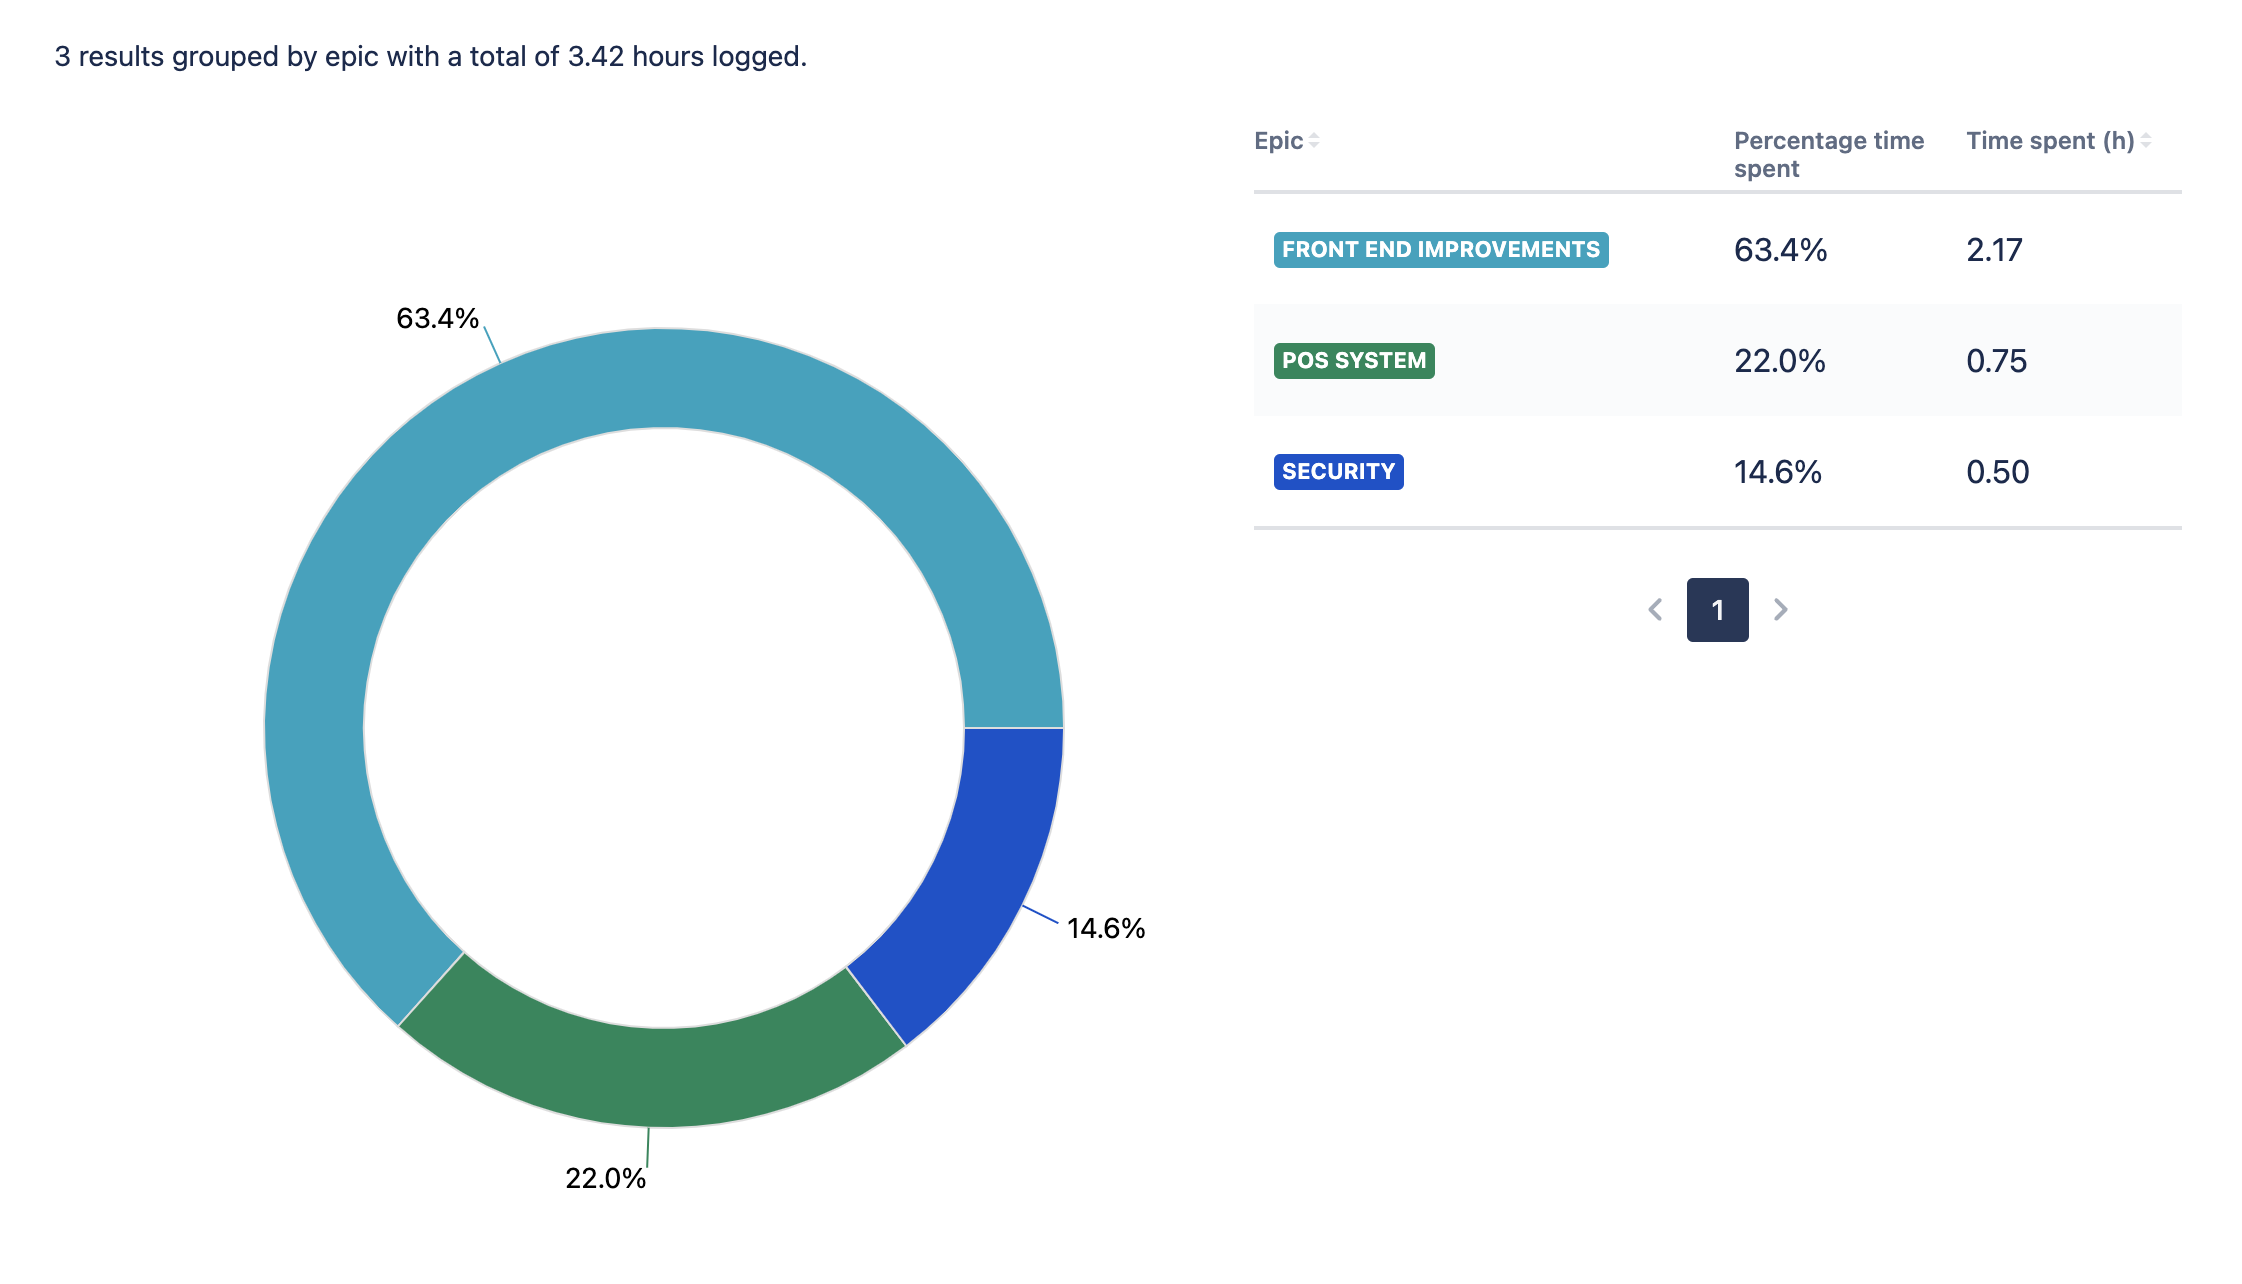
Pie Chart Display
Table Display
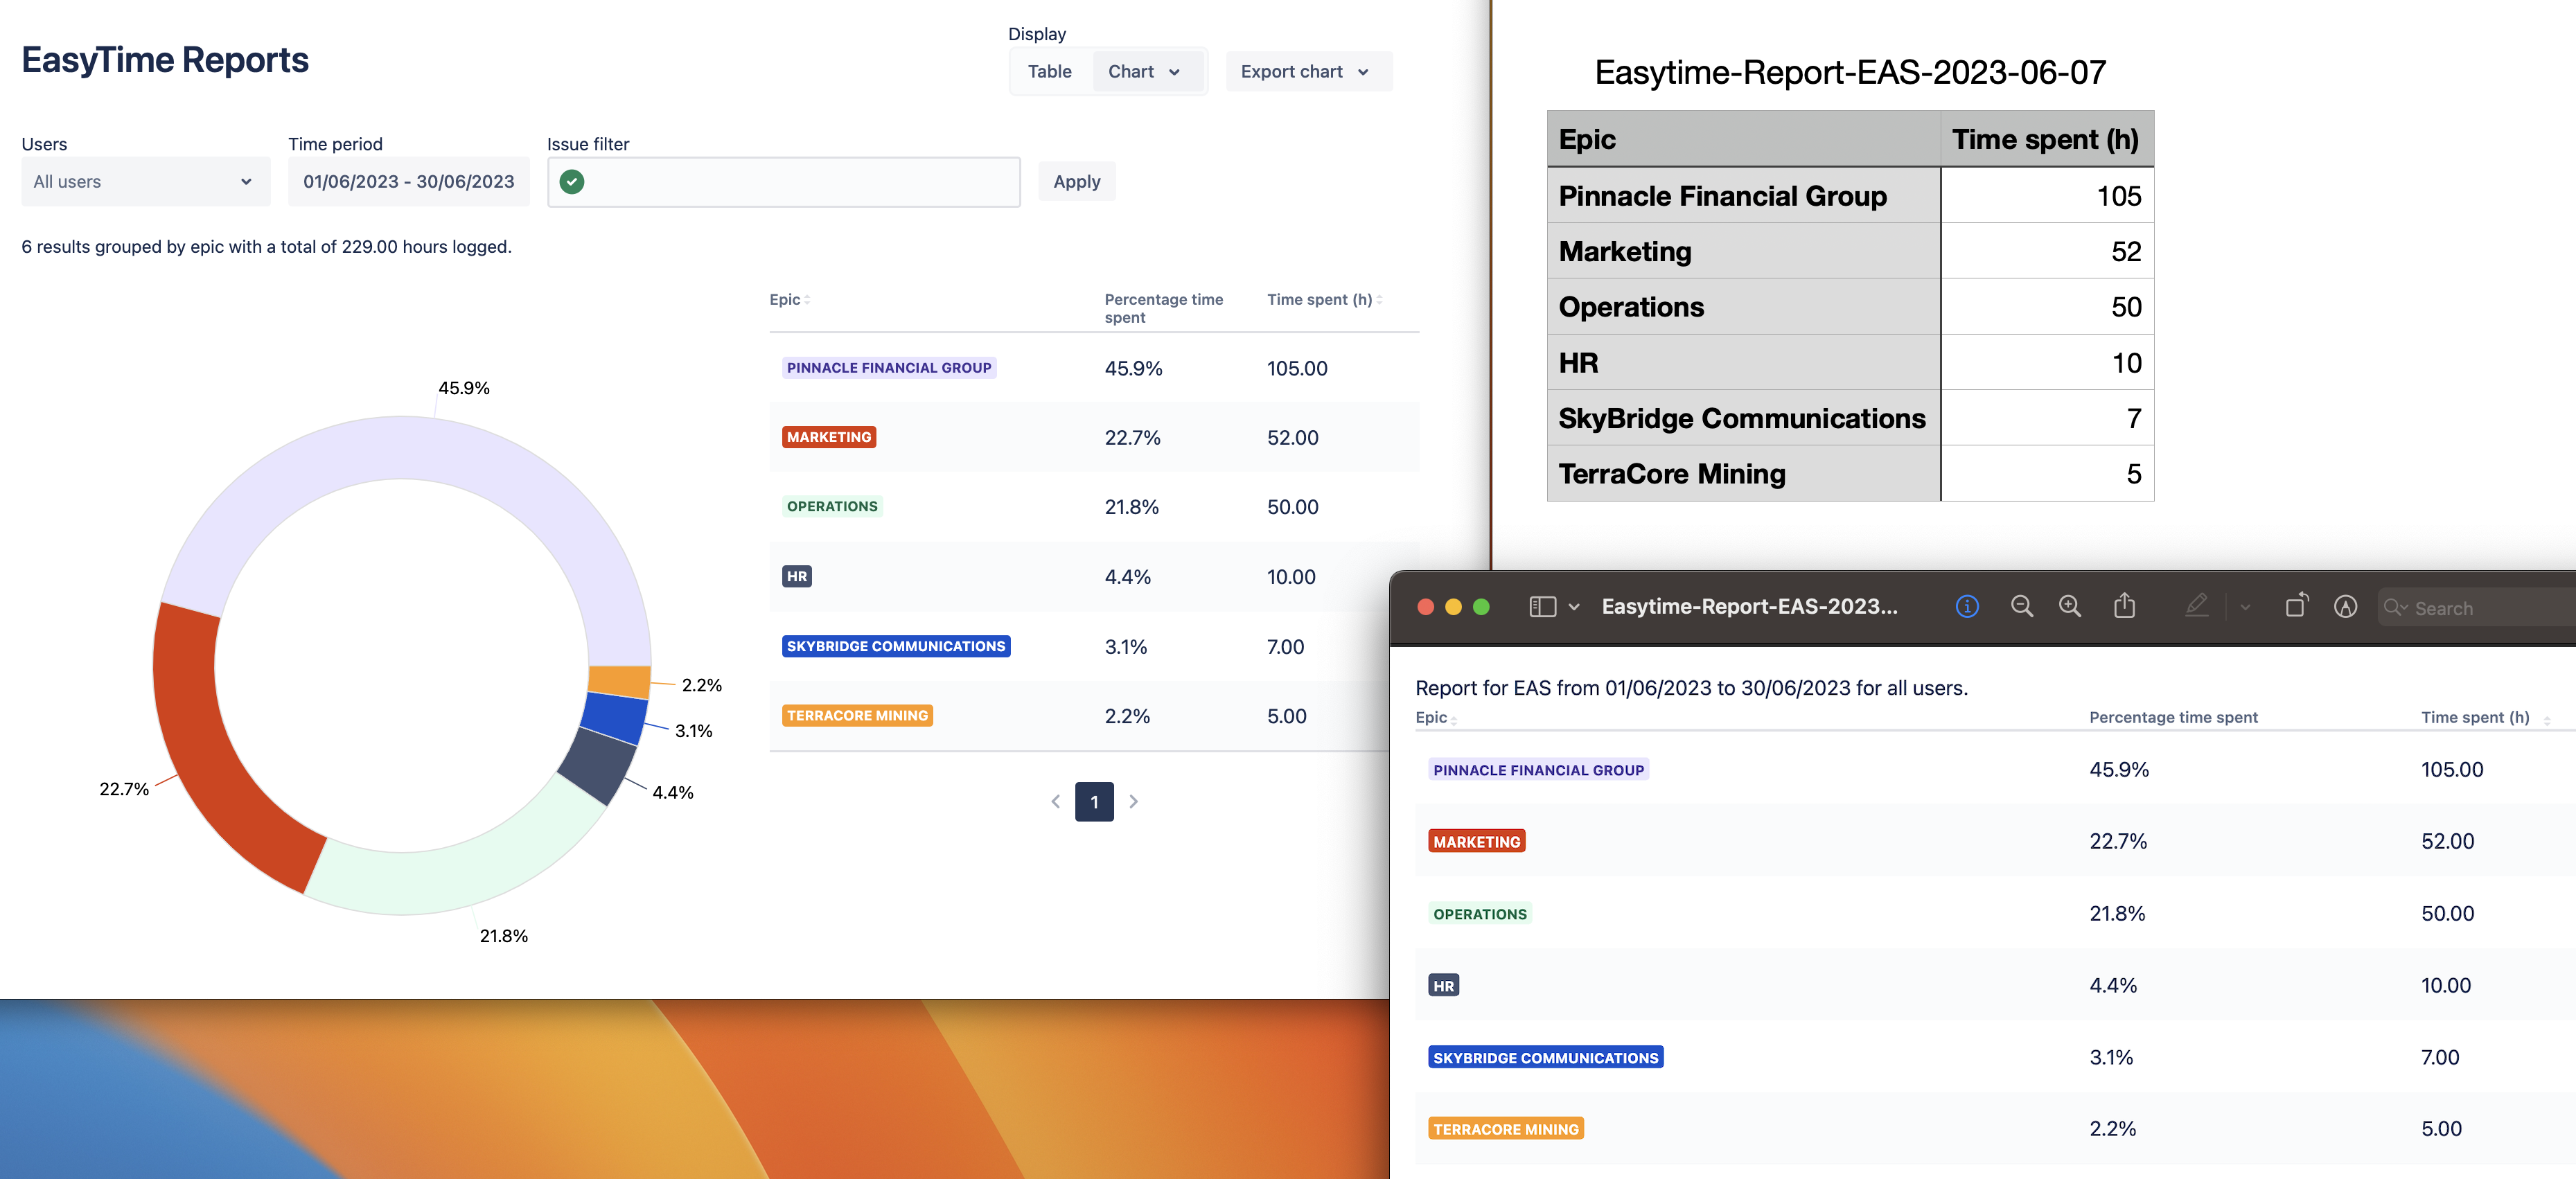
We have three different display types: a horizontal bar chart, a pie chart and a table. The benefits of being able to see your data displayed in different ways is to provide different perspectives, such as the pie chart for seeing relative time spent at a glance or the table for showing raw figures.
Filtering Data
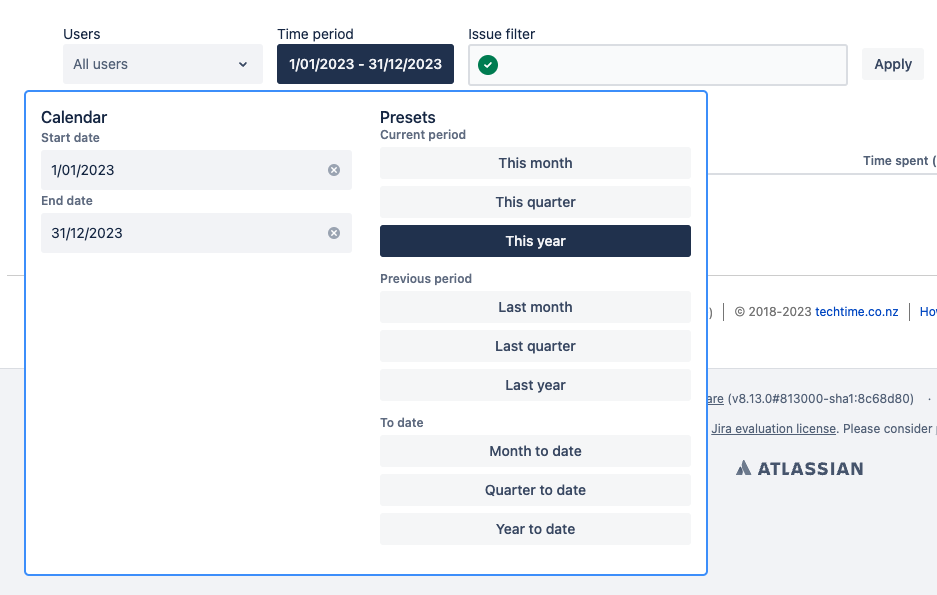
One of the key features of EasyTime reports is the ability to filter data. This means you can customise the report to only what is relevant to you. For example, you can filter the report to show only the time spent by certain users in your team or time spent on specific organisations. You can also filter it to show data for a specific date range. This makes it easier to focus on the data that is most important to you and allows you to quickly identify areas where you can improve your team's time management, as well as your own.
Exporting
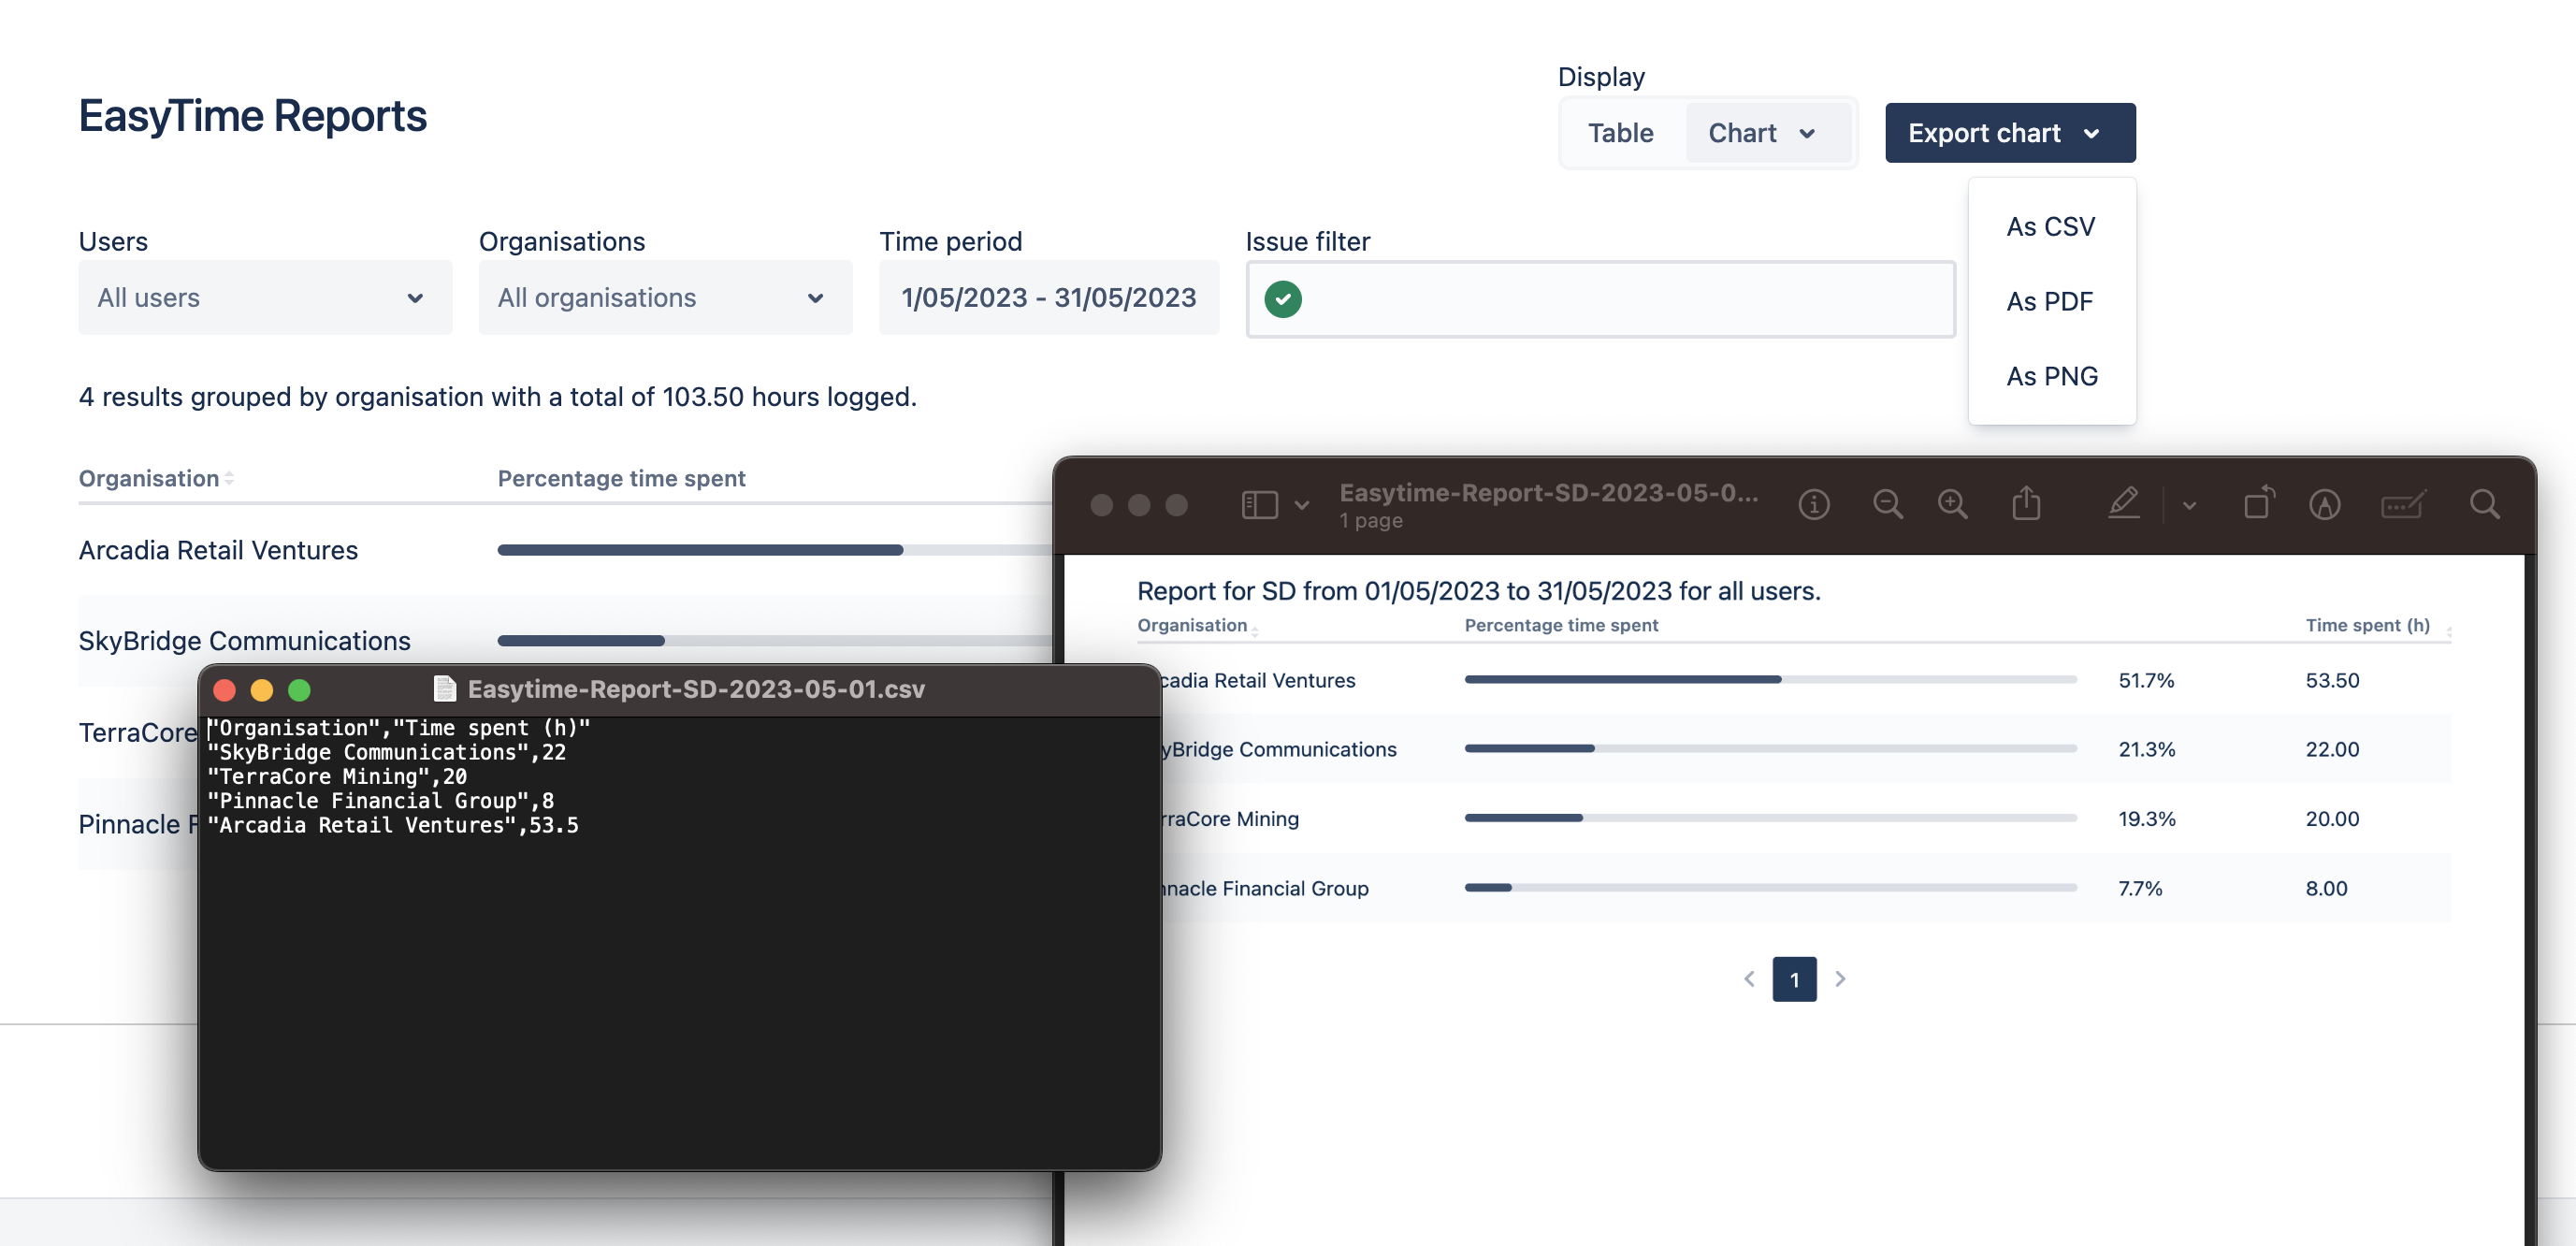
EasyTime reports also offer the ability to export data to various file formats such as CSV, PDF, and PNG. This feature allows you to save and share the report with others or to use the data in other applications. For example, you can export the report to Excel and use it to create pivot tables or other custom reports. This feature makes it easier to work with the data and to share it with others, which can be especially useful for team projects.
More information
Find EasyTime on Atlassian Marketplace, install via UPM, do the minimal configuration as per our Getting Started with EasyTime guide, review our Glossary, our FAQ and the full list of EasyTime Features. Enjoy consistent and accurate timesheets in real-time.
If you have any configuration questions or ideas for improvements, you can always contact us.
Contact us
